My New Year Resolutions
Only two things on my list
I need to find someone who can explain this to me…
…then, I need to understand this
The Standard
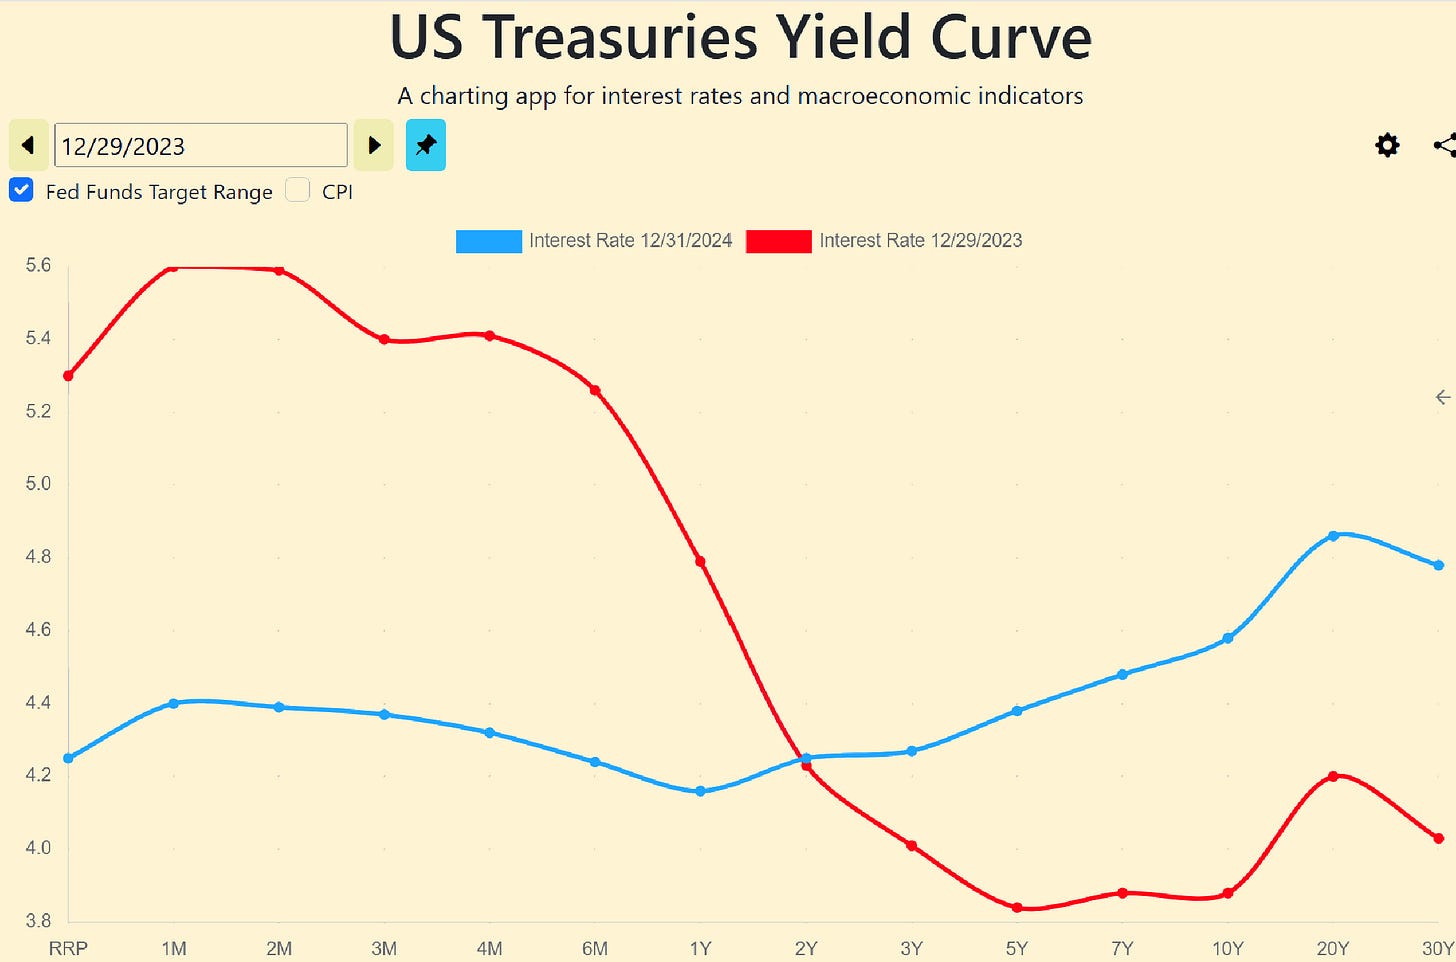
The most fluid and watched commodity in the world is money. For good reason. Money is something that stands in for what virtually everyone needs. It is the abstraction that represents what every soul on the planet gets up every day to do: Make their lives better today than yesterday. If you want steak or beans or gluten-free tofu for dinner tonight, you must devote part of today going through money to get to it. “Go through” is a metaphor for the cost of obtaining money. The name of that metaphor is “Interest Rate.” Interest rates vary over time. Interest paid to obtain money in 90 days is different than interest paid to obtain money 20 years from now. But how different? And in what direction? Should money obtained next month cost more or less than money obtained in January 2045? A partial answer to that question appears in the chart above.
We debate the future. We know that the future is uncertain, that we are all guessing. “We” is merely the aggregate of all the human beings on the planet at any one time, each interested in making their life better tomorrow than today, guessing about how to do it. All we have to measure an uncertain outcome is our expectation, our belief in the probability of outcomes. Will tomorrow be better or worse than today? More specifically, what are the the chances that what we do today will result in a better or worse tomorrow? Since we know that we exchange our actions today for outcomes tomorrow - expressed through the cost of money at those different times - the level of interest rates is a proxy which represents our collective expectation of the future. Each rate is a different expectation about a different future at that point in time.
On the assumption that there will be a “day after tomorrow,” all of our expectations, updated by new information, “rollover” each day to the next. The extension of that is a month rollover; a year rollover, a decade… We all believe (or don’t!) in some sort of future and we express our expectation of that future in what we are willing to pay to obtain money at a future time. The image of that expression over various different time periods is known as a “Yield curve,” two of which are depicted in the chart above.
What a difference a year makes
A simple, on-the-ground, conundrum is deciding how hard it will be in the future to do any particular thing. Will it be harder in 2025 to obtain food, buy a house, educate our children? Apply those same questions to a year from now? To 2045? One interpretation of interest rates higher at one time than another is that it is harder to get things done during periods of higher interest rates. Since predicting an unfolding future gets harder as the time ahead lengthens, it is natural to expect that the uncertainty of things a long time from now will impose higher costs than the uncertainty of tomorrow. For this reason, a “normal” yield curve, like the blue one above, rises gently upward to the to the right in the plot.
In the chart above, the red curve is one year ago. That color and that shape signaled a warning. The blue curve is today. Last New Years Eve - just as we did last night - we all went to bed wondering what obstacles we would face in the coming year. Chief among these last year was the composition of government (a fear that never goes away). We know from experience that government improves very few things, net of the problems it causes. How hard it is to get anything done tomorrow is very much a function of the obstacles placed in our way by government today.
The bottom (?) line
Our best hope, on this first day of this New Year, is that the yield curve today signals that fewer signs like the one you see at the top of this missive will be placed in front of us tomorrow.


The very appropriate zoo sign finally answers the question that I have been asking for four years. What is the definition of WOKE.
HAPPY NEW YEAR ROGER, LOVE YOU, BILL